Infographics: Data that tells stories
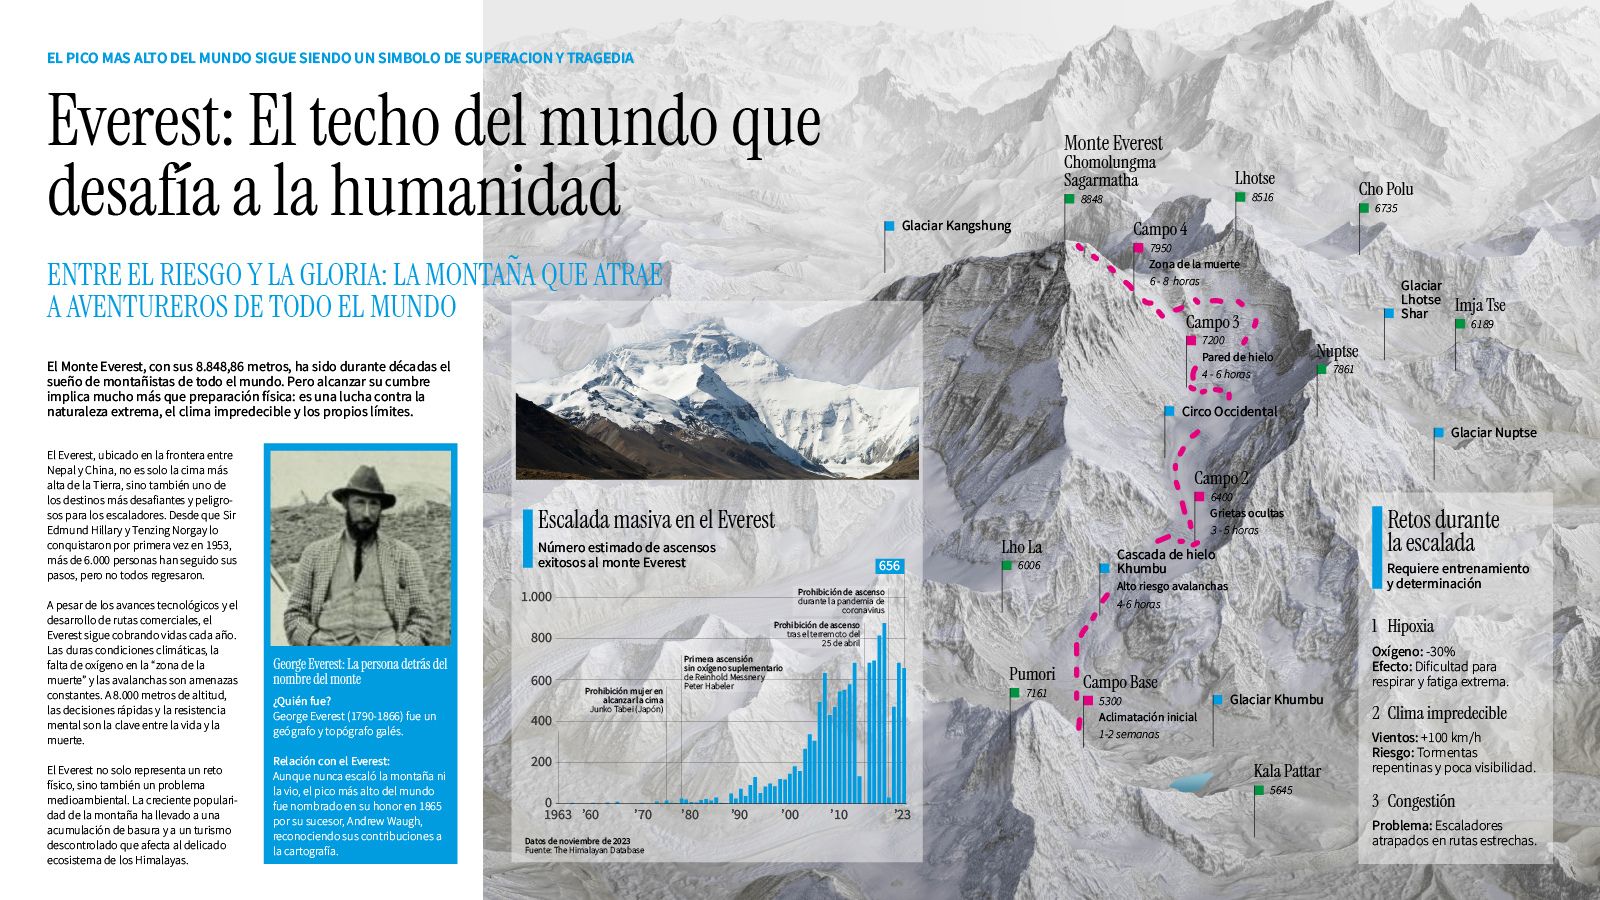
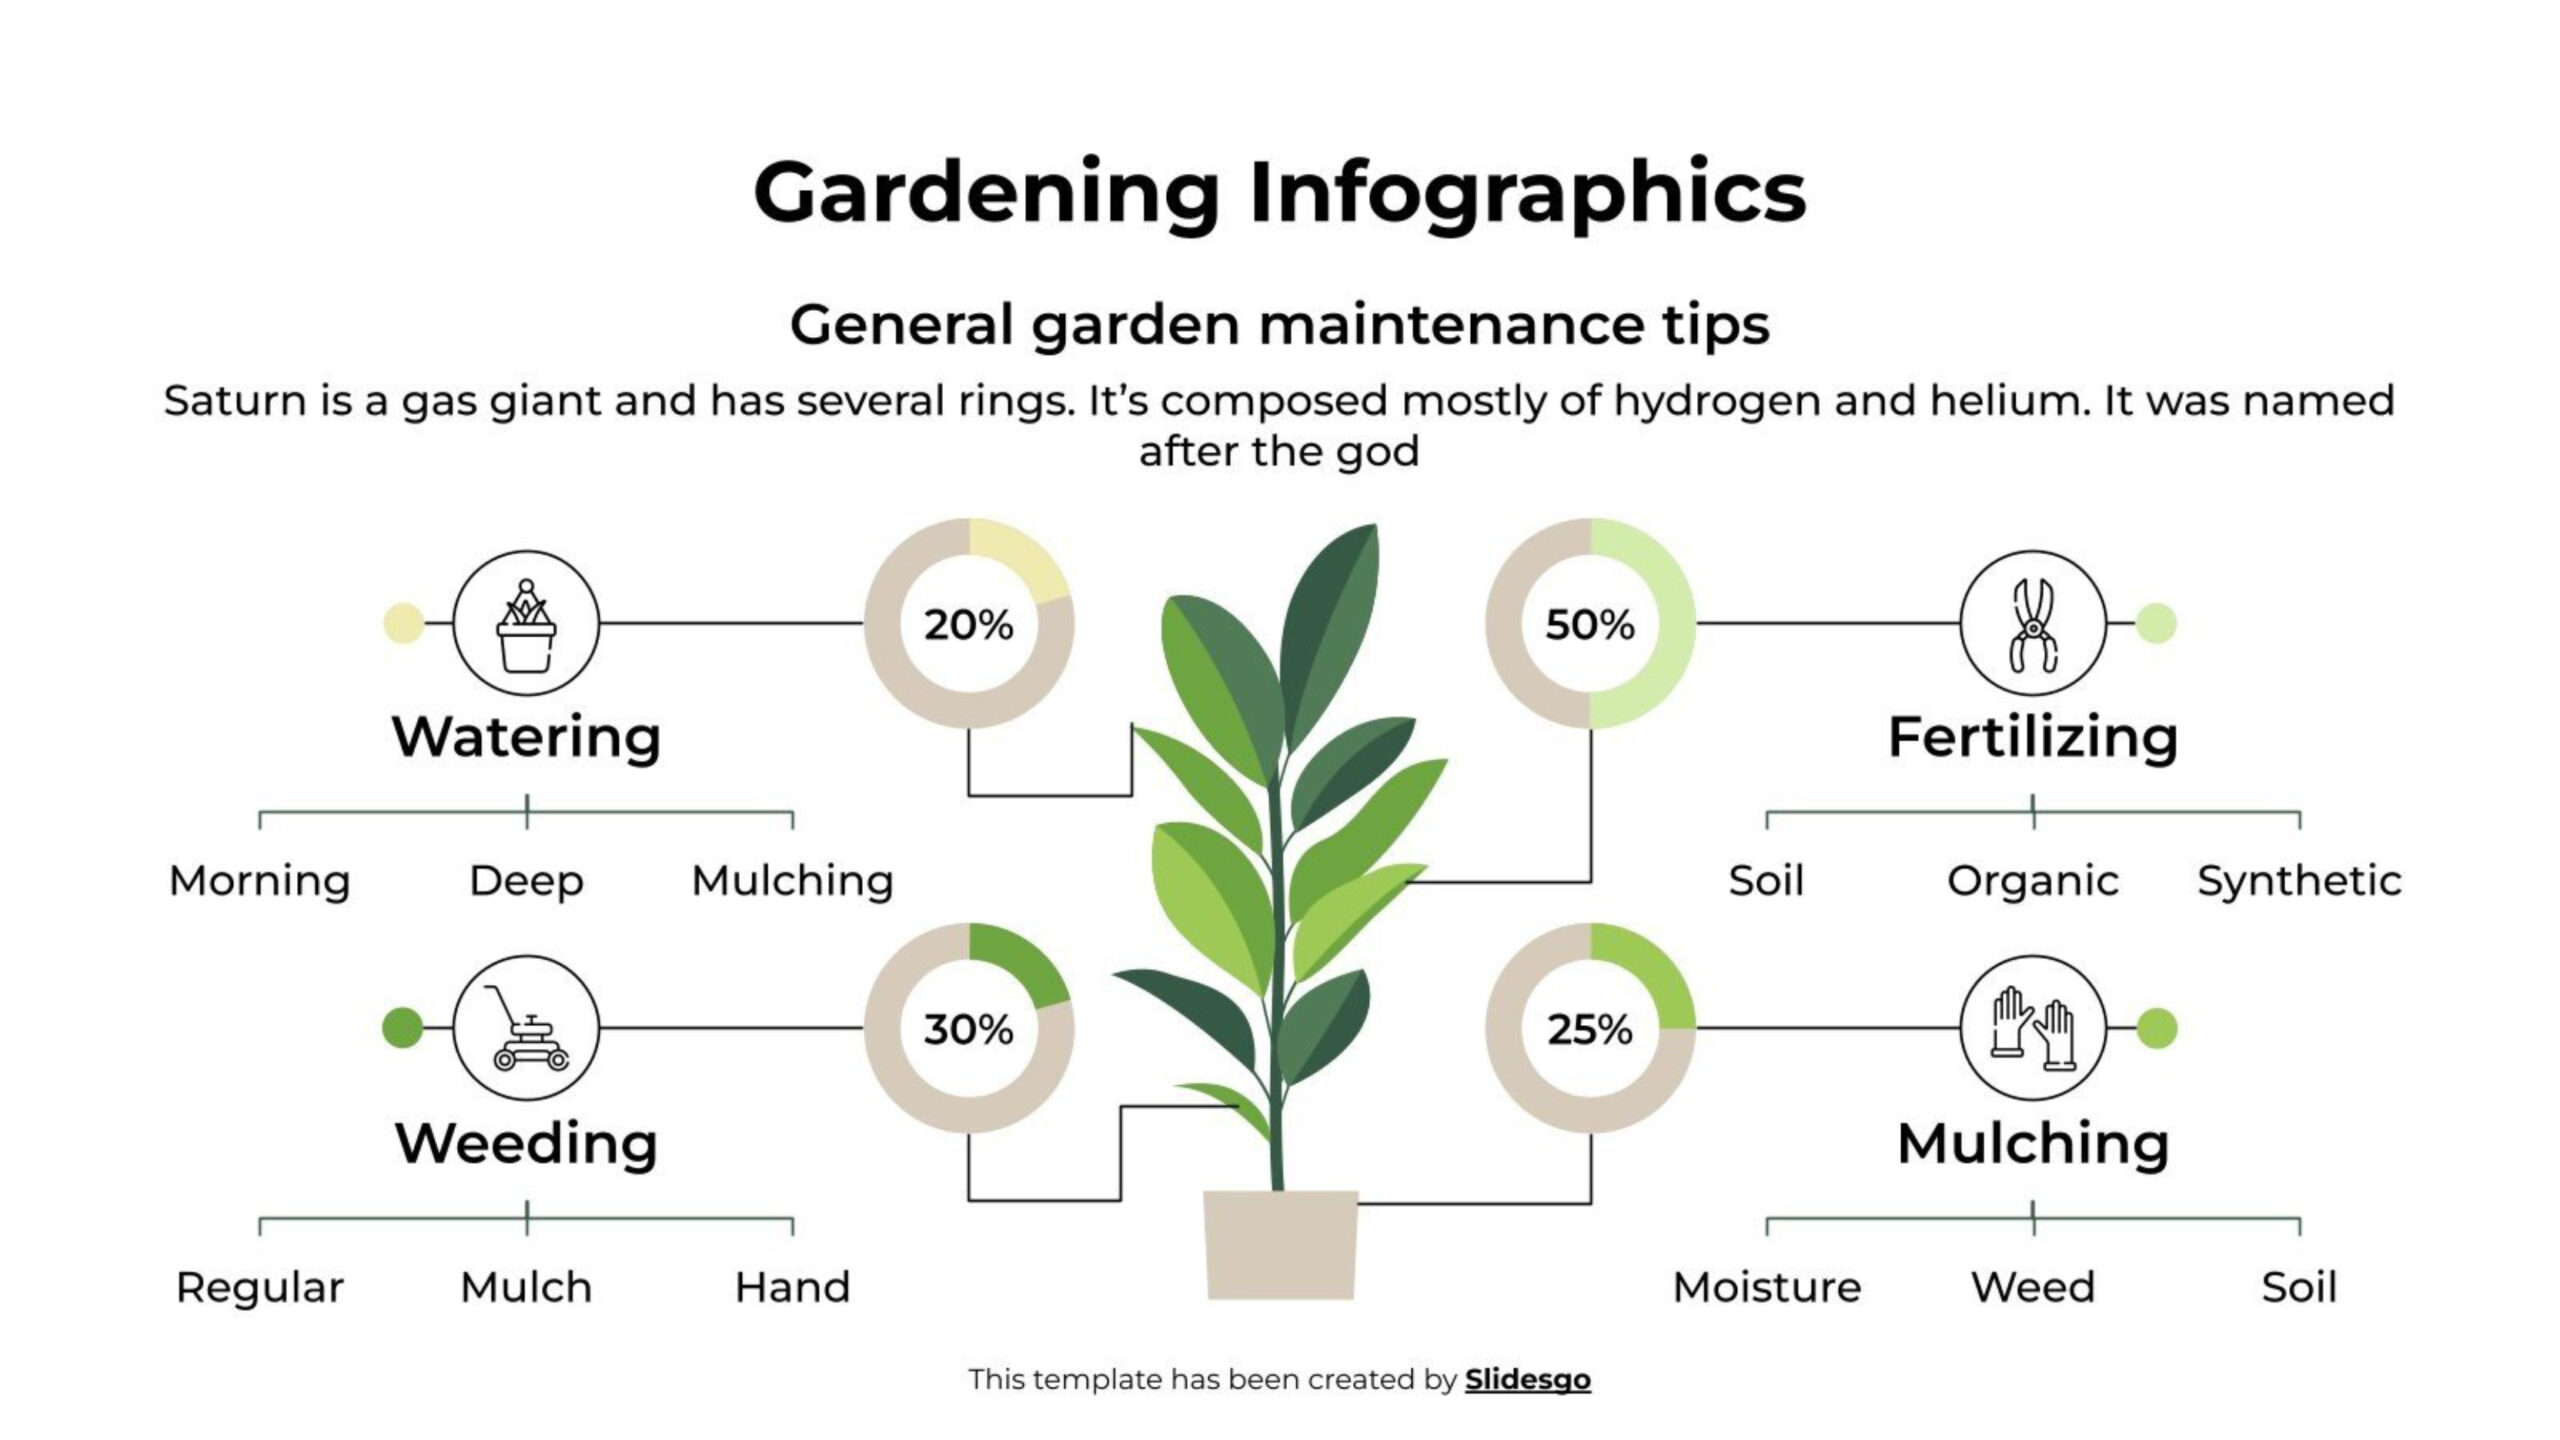
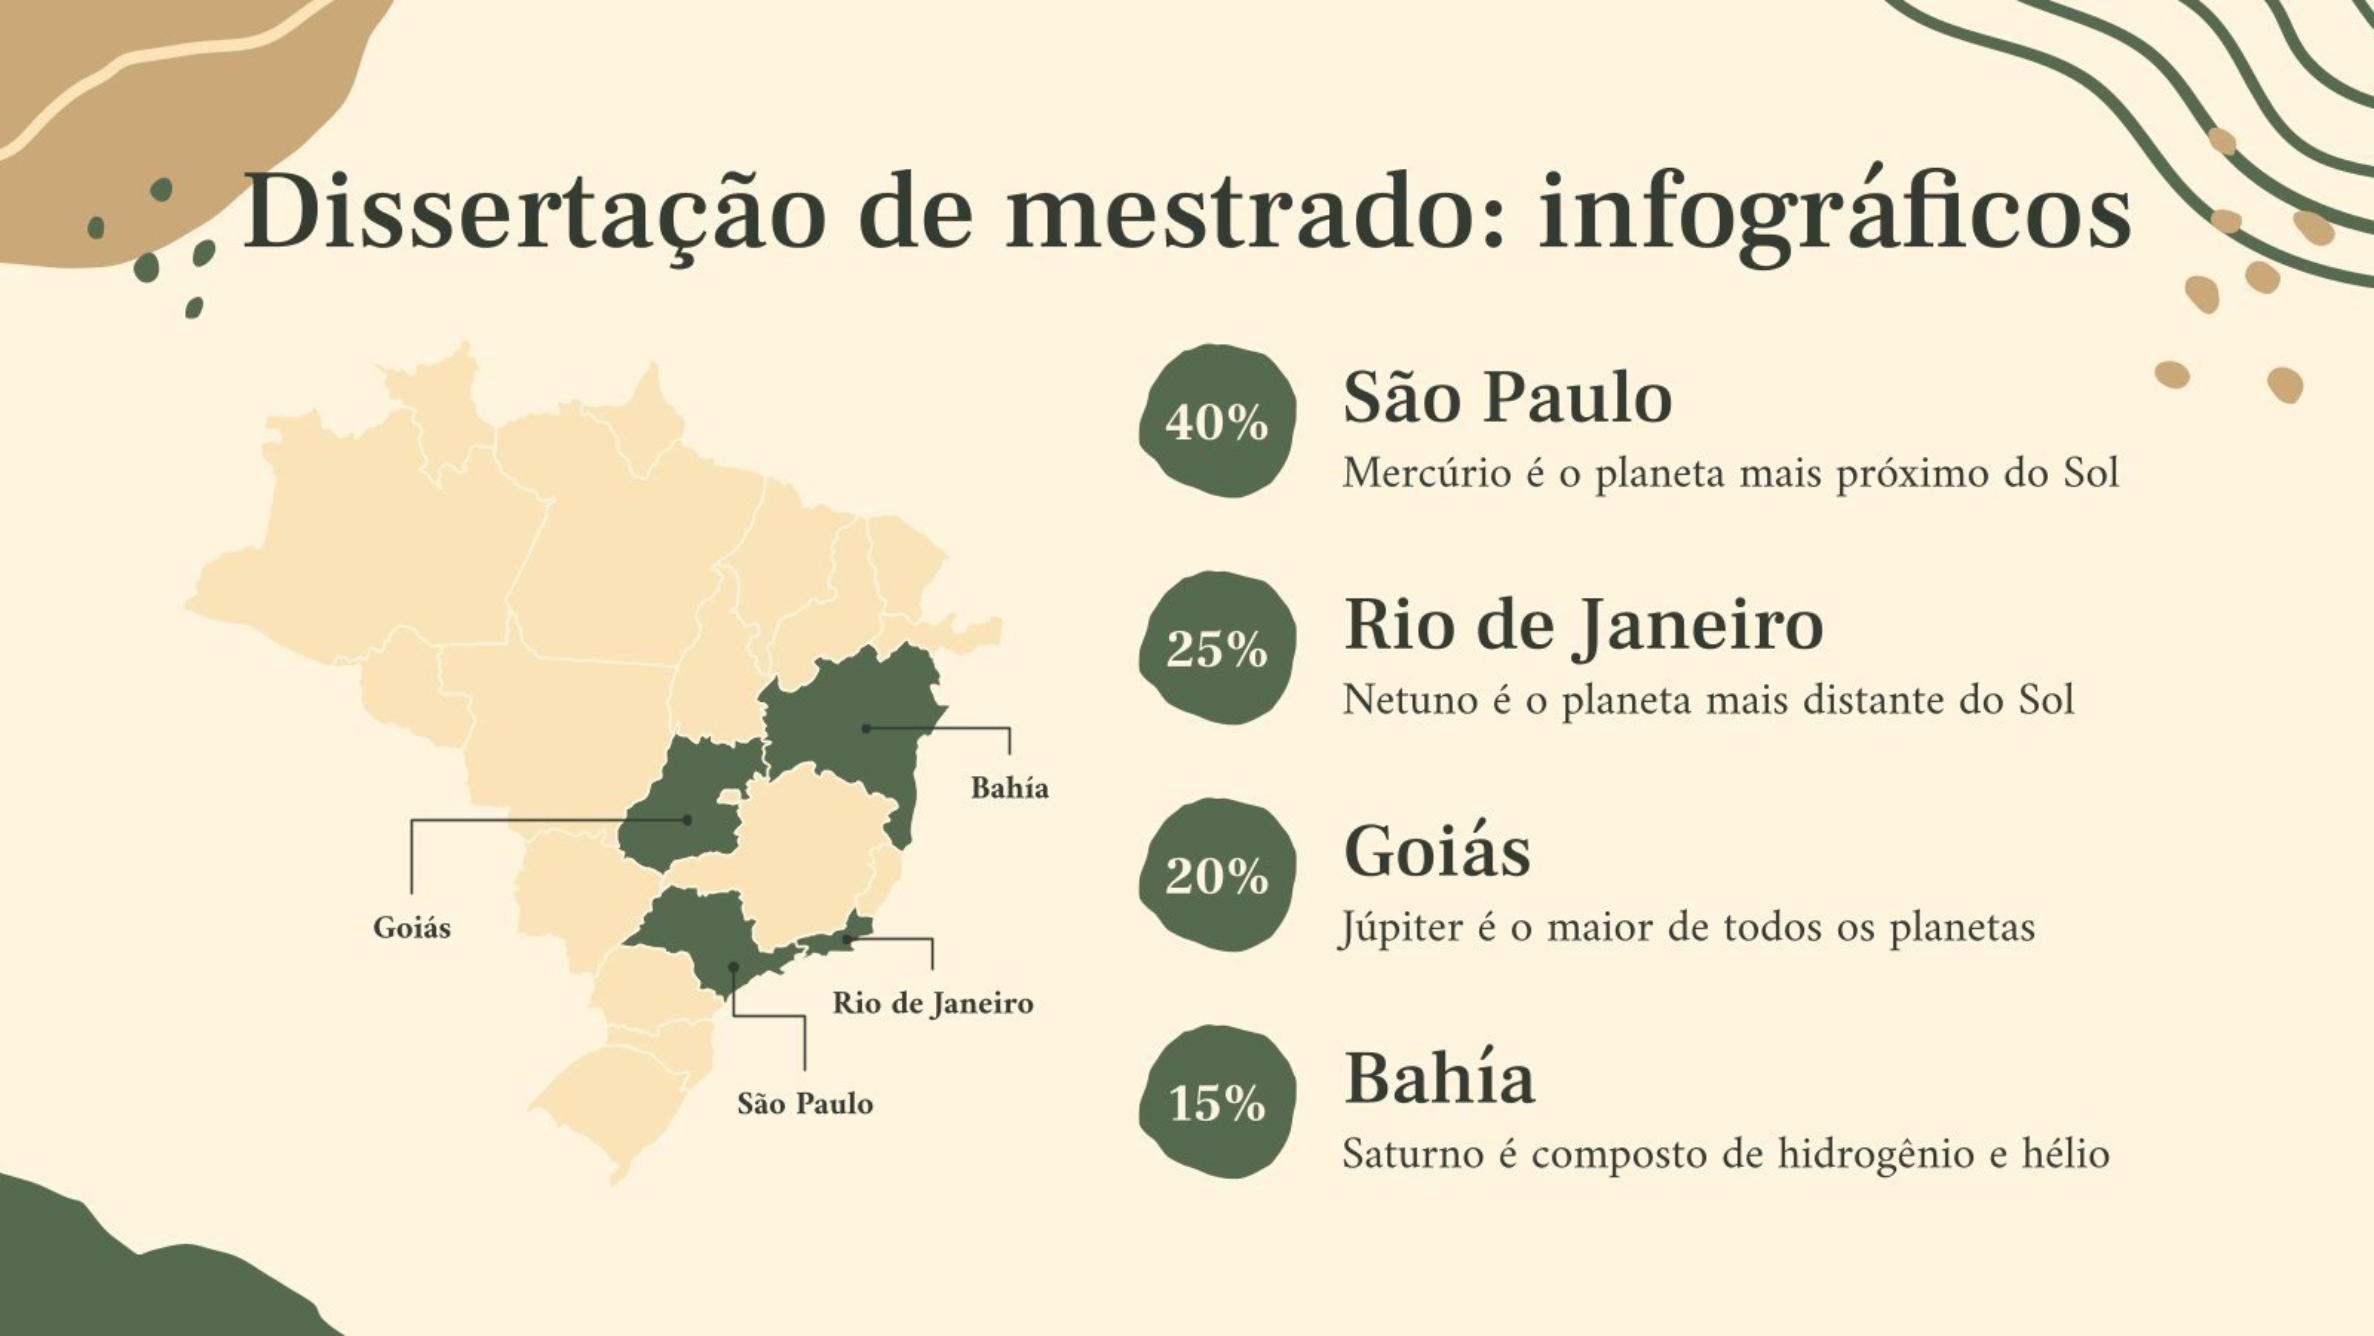
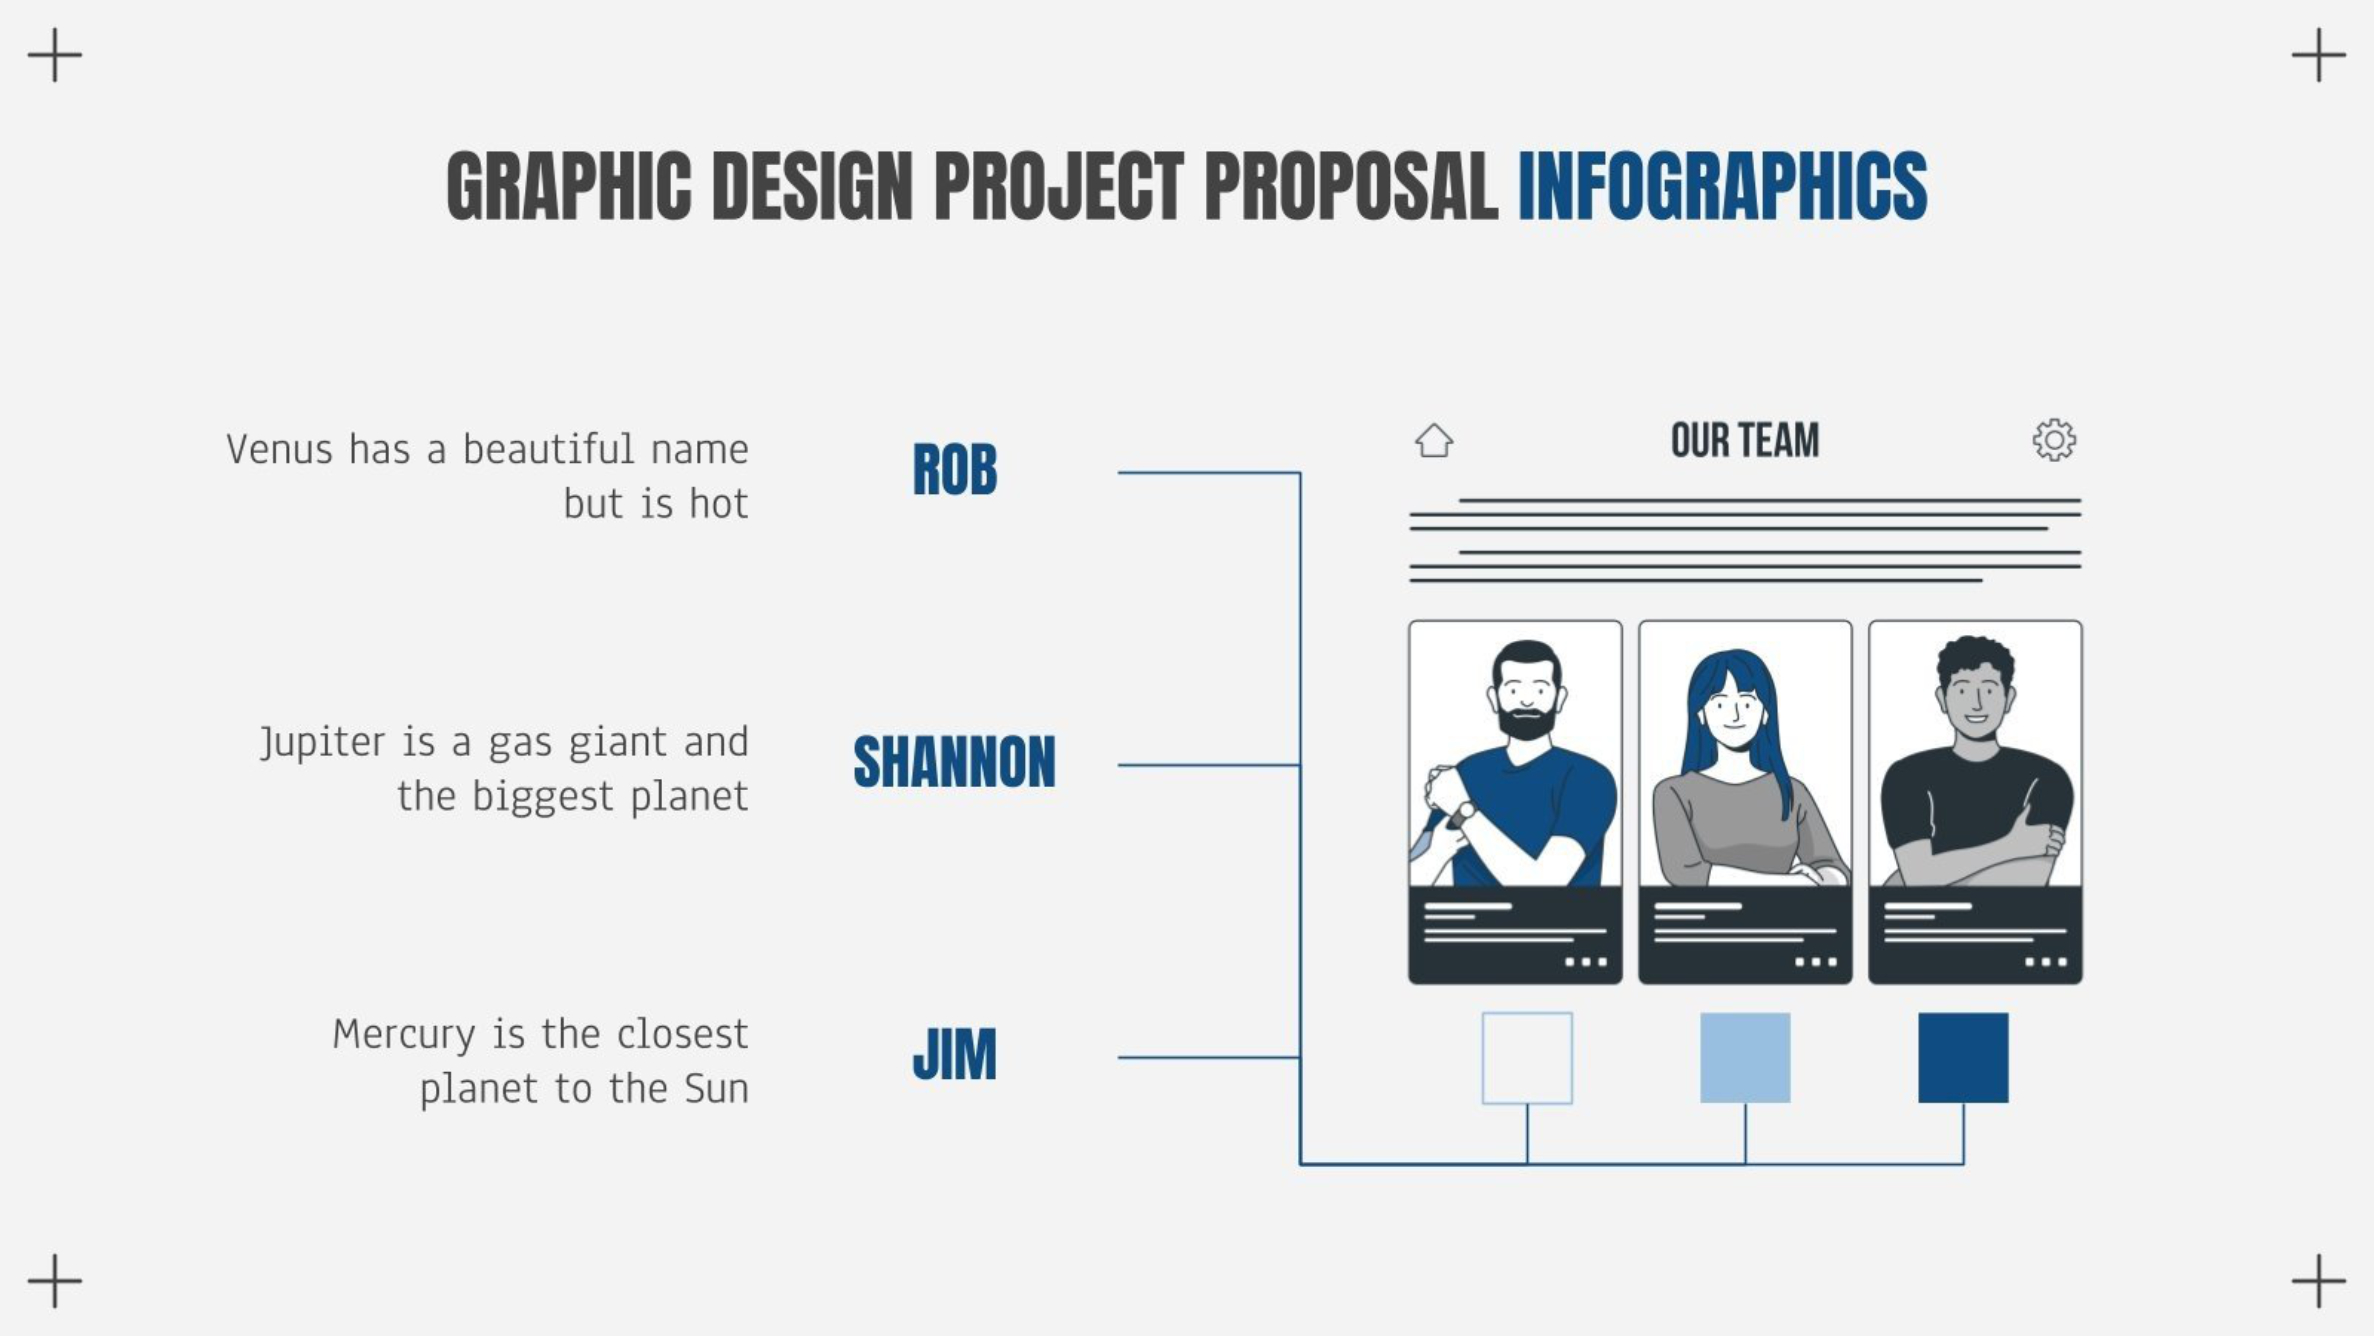
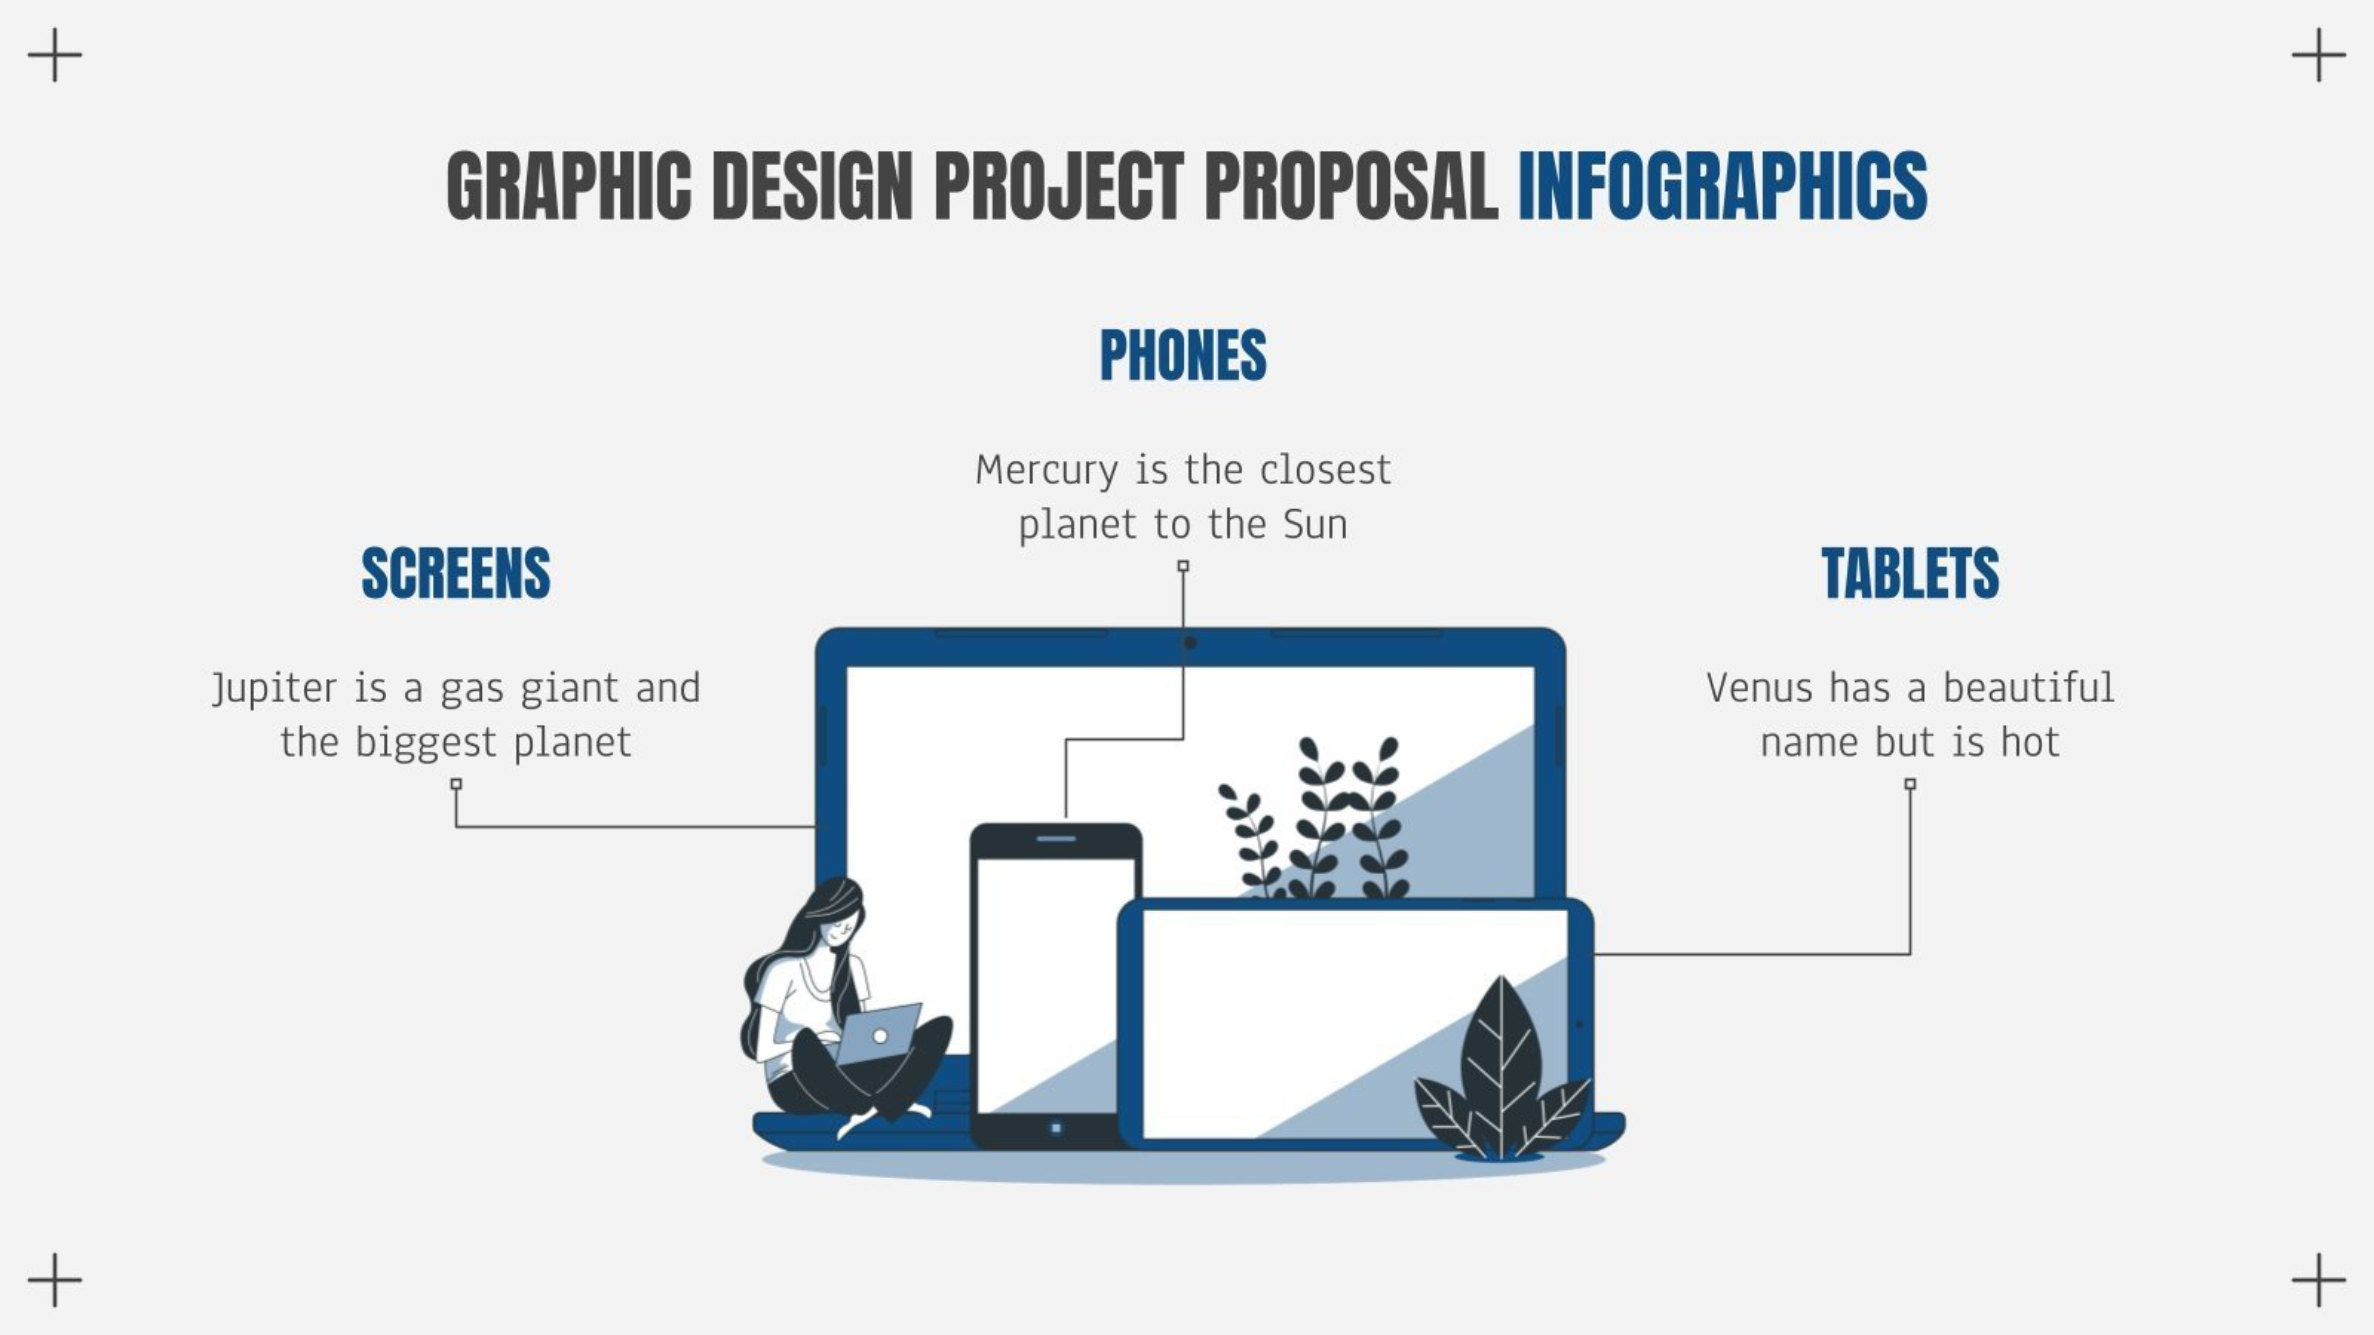
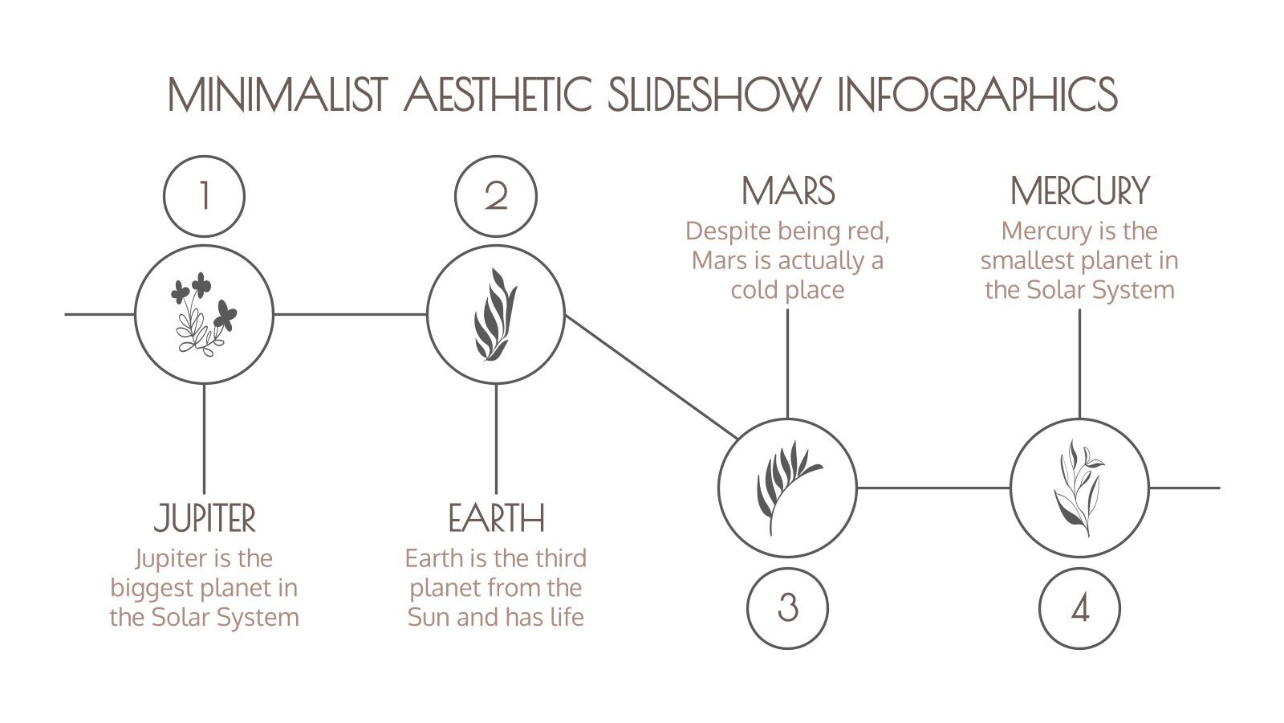
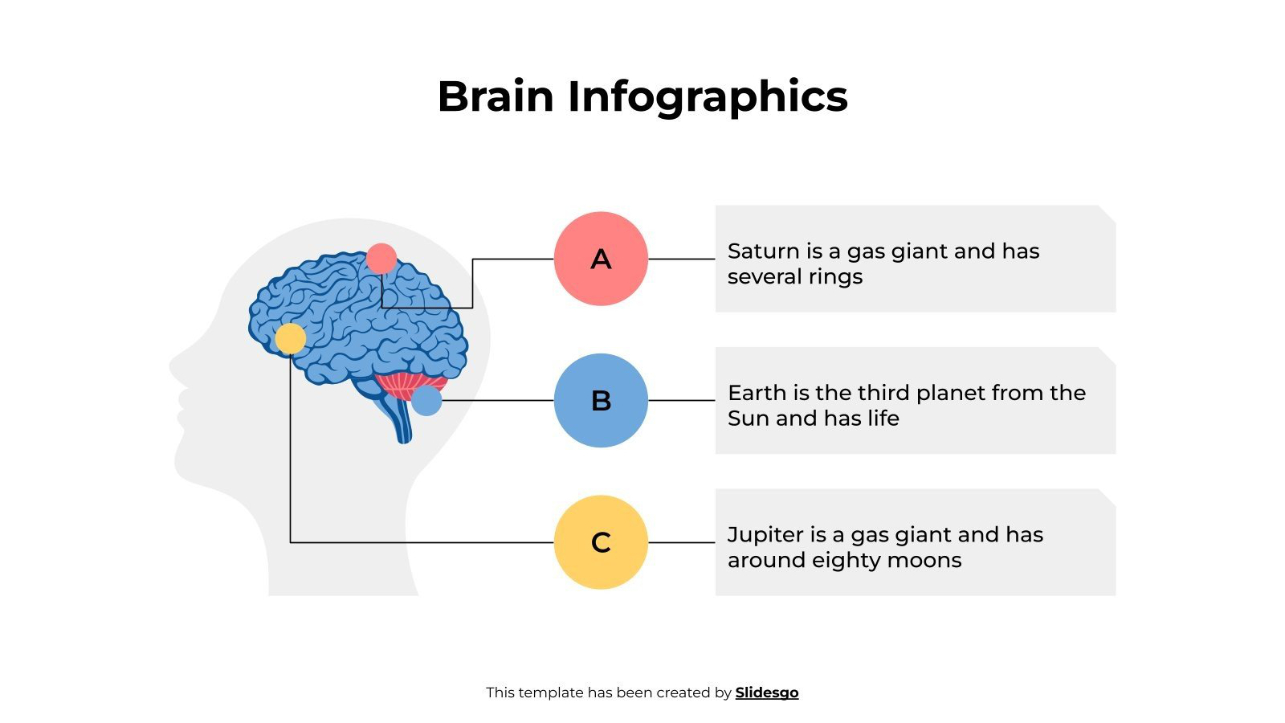
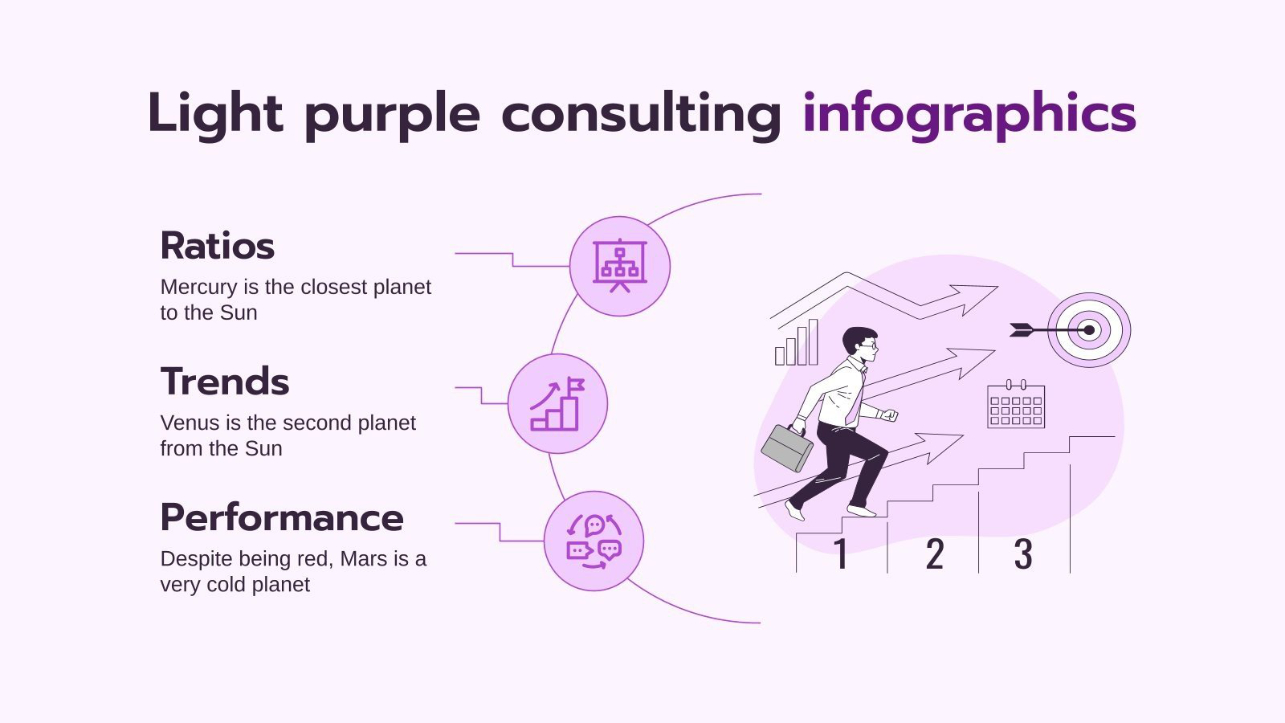
Each infographic is a visual challenge. I’ve worked with newspapers, magazines, and platforms like Freepik to transform complex information into clear and engaging graphics.
From reports to editorial content and educational material, my approach combines design, storytelling, and precision. I analyze the data, establish visual hierarchy, and use color, icons, and composition to guide the reader.
Here’s a selection of my work:
